“What is going on?”
“What’s gonna happen?”
These are important questions that I ask myself all the time. In business, you need to know the answers.
A good dashboard, customized for your business will provide answers.
My greatest influence on this topic was Kraig Kramers the author of CEO Tools. When he spoke to the Vistage group I belonged to I remember him emphasizing that we figure out ‘What causes sales’.
Chapter 3 of his book is about Tracking What’s Meaningful in your business:
“The greatest killer of businesses is the lack of responsive tracking and, in turn, lack of anticipatory action resulting from the lack of tracking or just non-action.”
To keep track of your business, “What is happening now?” is important.
Answers come from many sources. There are financial answers such as sales, payroll, and expense. There are sales/marketing answers such as leads and new customers. There are operational answers such as production, inventory, and deliveries.
A great dashboard will show you trends and specific metrics for the data you need to know things are on track. Or, if not on track, what to address.
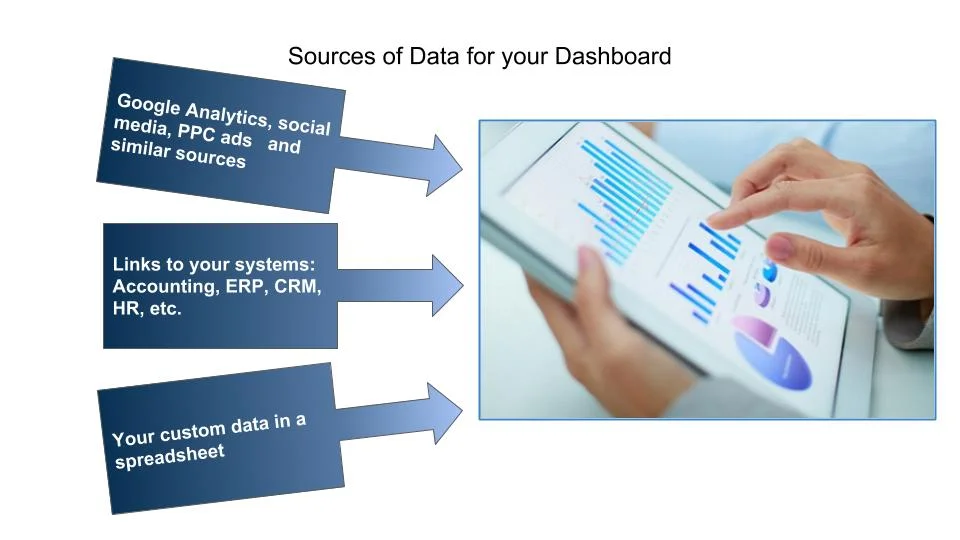
This information might come from different people using different systems in various locations. That is OK. The job of the dashboard is to automatically bring these pieces of data together. Then the dashboard displays your data. Data display should be simple and easy to understand.
“What is going to happen?” is an even more important question. This is where Key Performance Indicators (KPIs) are invaluable.
A KPI is a metric of something that we can measure right now but it is a leading indicator of what is going to happen. So that “anticipatory action” can happen.
Examples include:
The number of leads coming into the business might be an indicator of future sales. If leads go down, that might signal trouble in the future.
The number of sales calls scheduled could be another leading indicator suggesting action.
Inventory is a leading indicator that can tell you the future in some businesses.
Customer Satisfaction and Retention – How do they rate the business and do the buy again
Customer Lifetime Value – How much do average customers purchase over a longer period of time
# Customers per Employee –
Sales per Employee
Cost per lead
Net Promoter Score – how likely customers are to recommend your business
Net profit margin
Capacity Utilization Rate – how much work are you doing compared to the overall capacity
Return on Investment – overall or by segments, revenue generated in relation to the cost of the investment
A great dashboard is a valuable resource. It needs to be YOUR dashboard though. You can copy some KPIs from others but every business is somewhat unique. Make sure your dashboard suits you.
Kraig Kramer’s book is from 2002 but still has lots of relevant ideas. It is available on Amazon: Click here!
These questions help you stay informed about the current state of your business and make informed decisions for the future. Understanding what is happening and what is likely to happen allows you to take proactive and anticipatory actions to ensure the success of your business.
A well-designed dashboard, customized for your business, can consolidate and present important data and metrics in a clear and accessible manner. It helps you track various aspects of your business, such as financial performance, sales and marketing, and operational efficiency, providing you with valuable insights to make informed decisions.
Kraig Kramers is the author of CEO Tools and an influential figure in the field of business management. He emphasizes the importance of understanding the factors that drive sales in a business. Tracking meaningful metrics and taking proactive actions based on the insights gained from tracking are key components of his approach.
A dashboard can provide answers regarding various aspects of your business, including financial performance (e.g., sales, payroll, expenses), sales and marketing (e.g., leads, new customers), and operations (e.g., production, inventory, deliveries). It helps you monitor trends, identify specific metrics, and assess whether things are on track or if any areas require attention.